ECharts常用配置项
前言
ECharts是我们常用的图表控件,功能特别强大,每次使用都要查API比较繁琐,这里就记录开发中常用的配置。
官网:https://echarts.apache.org/handbook/zh/get-started
配置项:https://echarts.apache.org/zh/option.html#title
第三方示例平台:https://www.makeapie.cn/echarts
主题:https://echarts.apache.org/zh/theme-builder.html
引用
安装
1 | npm install echarts --save |
依赖如下
1 | "dependencies": { |
引用
1 | import * as echarts from 'echarts'; |
VUE封装图表自动缩放
VUE封装组件,让图表随页面变化自动缩放。
@/assets/utils/debounce.js
1 | /** |
@/assets/utils/chat_resize.js
1 | import { debounce } from '@/assets/utils/debounce.js' |
自定义图表组件中调用
1 | import * as echarts from 'echarts' |
完整示例
ZChart.vue
1 | <template> |
具体的数据
user_score_list.json
1 | [ |
配置项
背景色
1 | backgroundColor: new echarts.graphic.RadialGradient(0.3, 0.3, 0.8, [ |
graphic 背景图
注意
这个会在图表的下层,不能实现覆盖在图标上的效果。
示例
1 | graphic: [ |
恢复/保存
1 | toolbox: { |
title 标题
标题组件,包含主标题和副标题。
1 | title:{ |
xAxis/yAxis(x轴/y轴)
直角坐标系 grid 中的 x/y 轴,一般情况下单个 grid 组件最多只能放上下两个 x/y 轴,多于两个 x/y 轴需要通过配置 offset 属性防止同个位置多个x/y 轴的重叠。
基本
1 | xAxis:[ |
axisTick:坐标轴刻度相关设置。
axisLabel:坐标轴刻度标签的相关设置。
name:相关的是轴线一侧的文字,如显示单位。
自定义标签内容
1 | option = { |
设置文字样式
1 | xAxis: [ |
文字过长处理
1 | xAxis: [ |
不显示横线
1 | yAxis: { |
Y轴横线样式
1 | splitLine: { |
设置值区间
1 | yAxis: { |
设置单位
1 | yAxis: [ |
辅助线
1 | yAxis: [ |
不显示刻度
1 | xAxis: { |
grid
直角坐标系内绘图网格,单个 grid 内最多可以放置上下两个 X 轴,左右两个 Y 轴。可以在网格上绘制折线图,柱状图,散点图(气泡图)。
1 | grid: { |
四个方向都可以用百分比和具体数值
containLabel为true时,left right top bottom width height 决定的是包括了坐标轴标签在内的所有内容所形成的矩形的位置。
legend
图例组件。
图例组件展现了不同系列的标记(symbol),颜色和名字。可以通过点击图例控制哪些系列不显示。
1 | legend: { |
其中:
legend.type: plain/scrolllegend.orient: horizontal/verticallegend.itemGap: 图例每项之间的间隔。横向布局时为水平间隔,纵向布局时为纵向间隔。legend.icon:circle,rect,roundRect,triangle,diamond,pin,arrow,none
tooltip
悬浮框组件。
1 | tooltip: { |
或者
1 | tooltip: { |
或者
1 | tooltip: { |
或者
1 | tooltip: { |
其中
p.marker是小圆点
dataZoom
dataZoom 组件 用于区域缩放,从而能自由关注细节的数据信息,或者概览数据整体,或者去除离群点的影响。
1 | dataZoom: { |
series
折线图
1 | series: [ |
其中smooth: true是曲线。
不显示点
1 | seriesArr.push( |
主要是symbolSize: 0,
柱状图
1 | series: [ |
其中:
- emphasis:高亮的图形样式和标签样式。
横向柱状图
只需反转xAxis和yAxis即可
1 | grid: { |
上下叠加
1 | let seriesArr = []; |
添加"stack": "总量",即可
前后叠加
1 | let seriesArr = []; |
每个bar单独颜色
1 | {type: 'bar', xAxisIndex: 1, yAxisIndex: 1, data: valueArr, colorBy: "data"}, |
饼图
1 | series: [ |
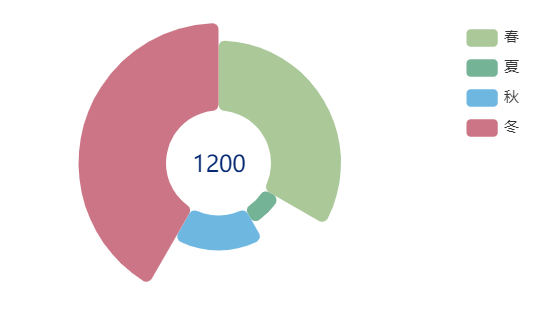
南丁格尔玫瑰图
1 | series: [ |
series[i].label
1 | { |
显示在内部
1 | label: { |
series[i].labelLine
1 | labelLine: { |
series[i].markLine 标识线
1 | markLine: { |
series[i].itemStyle.color 设置图形颜色
1 | itemStyle: { |
多个图形
1 | option = { |
关键的两个属性:
xAxis中的position: 'top'yAxis中的inverse: true
效果如下:
渐变色
线性渐变
1 | const specialColor = { |
径向渐变,前三个参数分别是圆心 x, y 和半径,取值同线性渐变
1 | var specialColor = { |
使用
1 | option={ |
symbol
默认图形
ECharts 提供的标记类型包括
'circle', 'rect', 'roundRect', 'triangle', 'diamond', 'pin', 'arrow', 'none'
本地图片
1 | let symbolImg = 'image://'+ require('@/assets/image/map-logo.png'); |
图片URL
可以通过 'image://url' 设置为图片,其中 URL 为图片的链接,或者 dataURI。
URL 为图片链接例如:
1 | 'image://http://xxx.xxx.xxx/a/b.png' |
图片DataURI
URL 为 dataURI 例如:
1 | 'image://data:image/gif;base64,R0lGODlhEAAQAMQAAORHHOVSKudfOulrSOp3WOyDZu6QdvCchPGolfO0o/XBs/fNwfjZ0frl3/zy7////wAAAAAAAAAAAAAAAAAAAAAAAAAAAAAAAAAAAAAAAAAAAAAAAAAAAAAAAAAAAAAAACH5BAkAABAALAAAAAAQABAAAAVVICSOZGlCQAosJ6mu7fiyZeKqNKToQGDsM8hBADgUXoGAiqhSvp5QAnQKGIgUhwFUYLCVDFCrKUE1lBavAViFIDlTImbKC5Gm2hB0SlBCBMQiB0UjIQA7' |
矢量图Path
可以通过 'path://' 将图标设置为任意的矢量路径。这种方式相比于使用图片的方式,不用担心因为缩放而产生锯齿或模糊,而且可以设置为任意颜色。路径图形会自适应调整为合适的大小。路径的格式参见 SVG PathData。可以从 Adobe Illustrator 等工具编辑导出。
例如:
1 | 'path://M30.9,53.2C16.8,53.2,5.3,41.7,5.3,27.6S16.8,2,30.9,2C45,2,56.4,13.5,56.4,27.6S45,53.2,30.9,53.2z M30.9,3.5C17.6,3.5,6.8,14.4,6.8,27.6c0,13.3,10.8,24.1,24.101,24.1C44.2,51.7,55,40.9,55,27.6C54.9,14.4,44.1,3.5,30.9,3.5z M36.9,35.8c0,0.601-0.4,1-0.9,1h-1.3c-0.5,0-0.9-0.399-0.9-1V19.5c0-0.6,0.4-1,0.9-1H36c0.5,0,0.9,0.4,0.9,1V35.8z M27.8,35.8 c0,0.601-0.4,1-0.9,1h-1.3c-0.5,0-0.9-0.399-0.9-1V19.5c0-0.6,0.4-1,0.9-1H27c0.5,0,0.9,0.4,0.9,1L27.8,35.8L27.8,35.8z' |
示例
饼图
基本
/components/ZPieChart01.vue
1 | <template> |
饼图 设置色值
1 | <template> |
主要设置了series[i].itemStyle.color
1 | itemStyle: { |
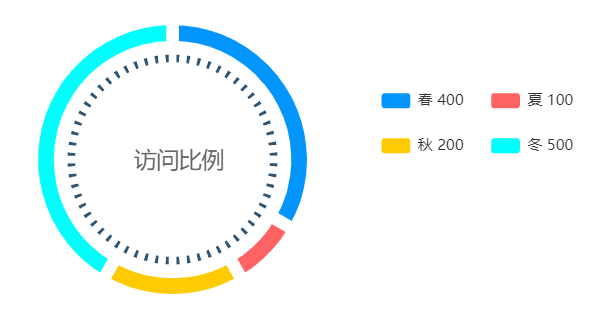
饼图 比例
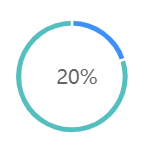
PieRateChart.vue
1 | <template> |
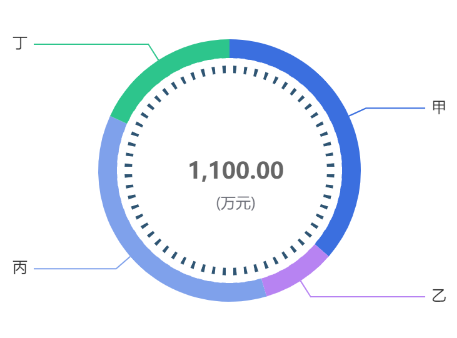
饼图
1 | <template> |
效果
折线图
单折线
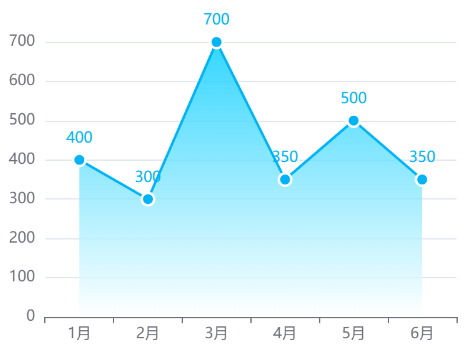
代码
ZLineSingleChart.vue
1 | <template> |
测试JSON
1 | [ |
多折线图

ZLinesChart.vue
1 | <template> |
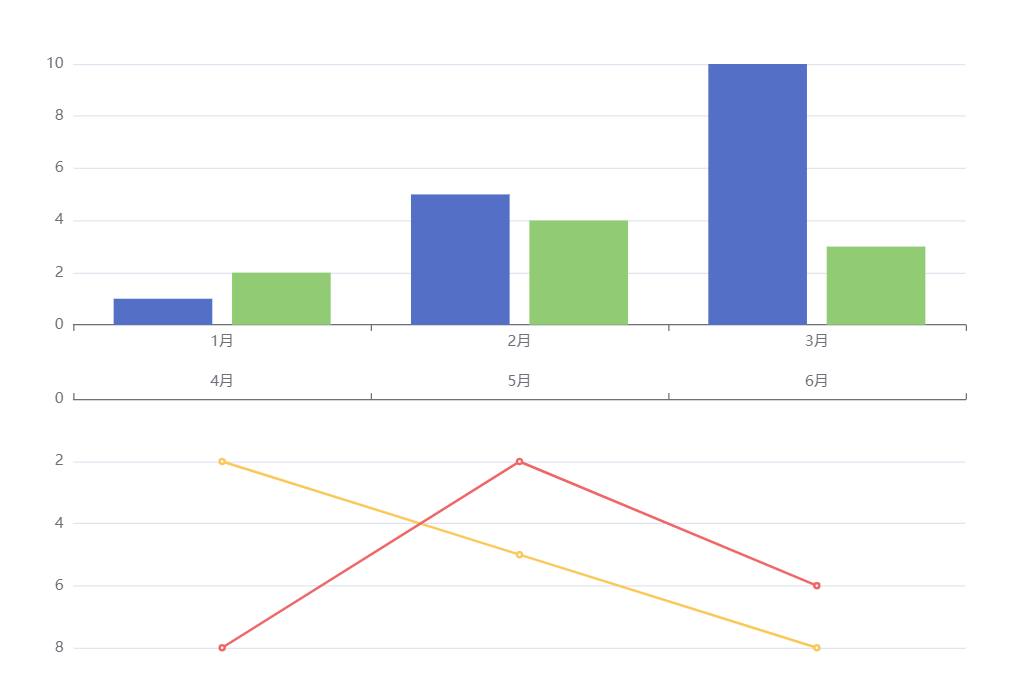
双Y轴
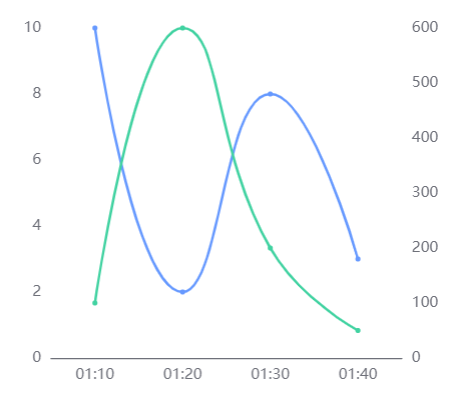
代码
ZLinesY2Chart.vue
1 | <template> |
柱状图
柱状图 环形

BarPolarChart.vue
1 | <template> |
柱状体 单个
ZBarChart.vue
1 | <template> |
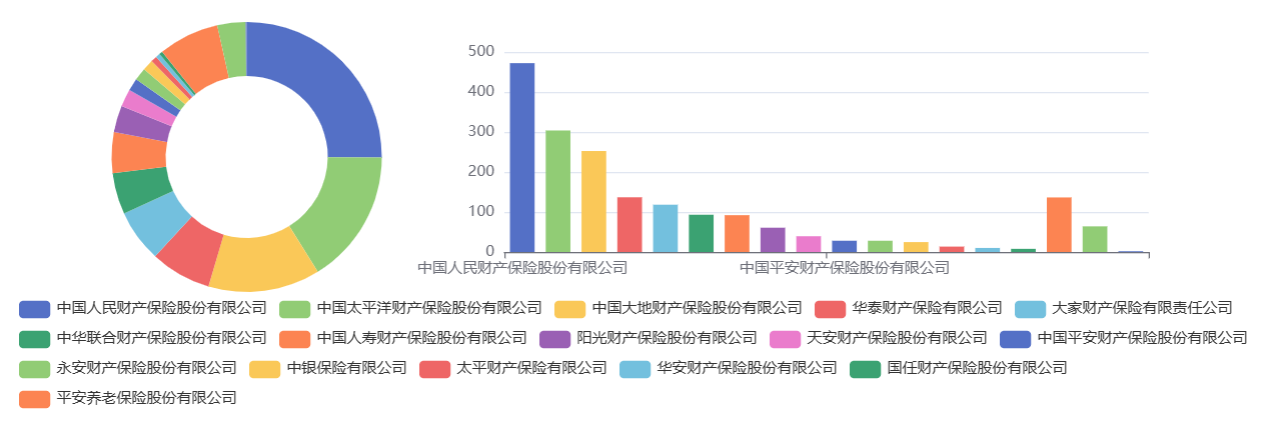
柱状体 多个
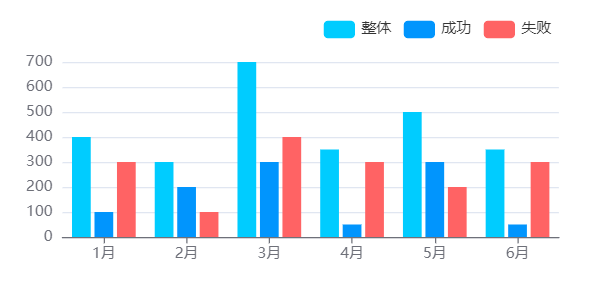
BarChart.vue
1 | <template> |
柱状体 横向
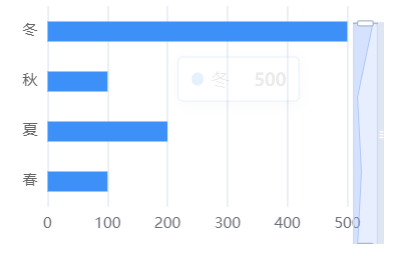
BarChartH.vue
1 | <template> |
散点图
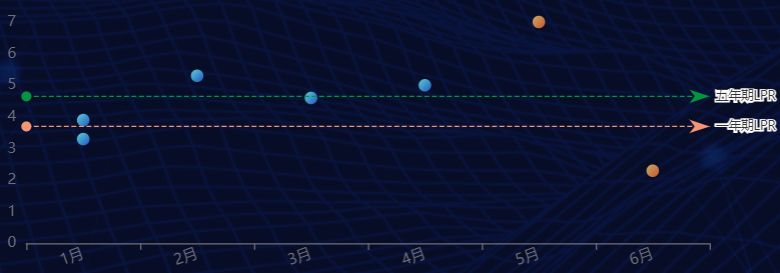
代码
1 | <template> |
图形组合
1 | <template> |
小技巧
Excel日期格式转字符串
有时我们想把Excel的数据转为JSON,但是日期格式获取的是数字,我们就要把数字改为文本。
1 | = TEXT(A2,"yyyy-mm-dd") |
金额格式化
方式1
1 | Vue.prototype.$qianFunc = function (num) { |
方式2
1 | Vue.prototype.$numFunc = function (num) { |
科学计数法
在 JavaScript 中,可以使用 Number 对象的 toExponential() 方法将数字转换为科学计数法格式。该方法接受一个参数,表示指数的位数。
以下是一个示例:
1 | let number = 123456789; |
在这个例子中,将数字 123456789 转换为科学计数法,指数的位数为 2,输出结果为 1.23e+8。
如果不指定指数的位数,则默认为 6 位。如果要将科学计数法格式的字符串转换回数字,可以使用 Number 对象的 parseFloat() 方法或 parseInt() 方法。例如:
1 | let scientific = '1.23e+8'; |
在这个例子中,将科学计数法格式的字符串 ‘1.23e+8’ 转换为数字,输出结果为 123000000。
1 | export const kxnum = (value, digit) => { |
数据处理
1 | export const data4_1 = [ |
表格滚动
1 | <table class="mytable"> |
设置渲染方式
方式选择
在软硬件环境较好,数据量不大的场景下,两种渲染器都可以适用,并不需要太多纠结。
在环境较差,出现性能问题需要优化的场景下,可以通过试验来确定使用哪种渲染器。
比如有这些经验:
在须要创建很多 ECharts 实例且浏览器易崩溃的情况下(可能是因为 Canvas 数量多导致内存占用超出手机承受能力),可以使用 SVG 渲染器来进行改善。
大略得说,如果图表运行在低端安卓机,或者我们在使用一些特定图表如 水球图 等,SVG 渲染器可能效果更好。
数据量较大(经验判断 > 1k)、较多交互时,建议选择 Canvas 渲染器。
设置代码
1 | // 使用 Canvas 渲染器(默认) |
数据变化重新渲染
1 | chart.setOption(option, notMerge, lazyUpdate); |
或者:
1 | chart.setOption(option, { |
参数解释:
option
图表的配置项和数据,具体见配置项手册。notMerge可选,是否不跟之前设置的 option 进行合并,默认为
false,即合并。lazyUpdate可选,在设置完 option 后是否不立即更新图表,默认为
false,即立即更新。silent可选,阻止调用 setOption 时抛出事件,默认为
false,即抛出事件。
第二个参数notMerge,将它设置为true即不合并之前的options,使用新的options。
响应容器的大小
1 | var myChart = echarts.init(document.getElementById('main')); |
注意和VUE结合使用时,一定要等待DOM渲染完毕再调用,否则不生效。
1 | async leftbar_click() { |
除了直接调用 resize() 不含参数的形式之外,还可以指定宽度和高度,实现图表大小不等于容器大小的效果。
1 | myChart.resize({ |