前言
官方文档
https://v0.lvcharts.com/App/examples/v1/Wpf/Line
常用图表的对应类型
- 柱状图的类型是 ColumnSeries;
- 折线图的类型是LineSeries;
- 进度环的类型是Gauge ;
- 饼状图的类型是PieChart ;
- 行图的类型是RowSeries,X轴和Y轴的处理方式与柱状图相反;
- 柱状堆积图的类型是StackedColumnSeries ;
安装
1
| Install-Package LiveCharts.Wpf
|
添加引用
1
| xmlns:lvc="clr-namespace:LiveCharts.Wpf;assembly=LiveCharts.Wpf"
|
代码中
1
| using LiveCharts;using LiveCharts.Wpf;
|
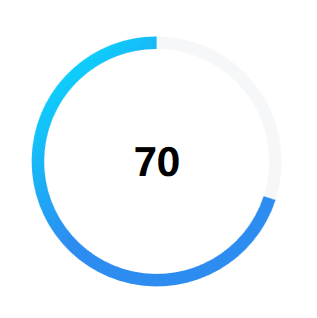
进度环
代码
1
2
3
4
5
6
7
8
9
10
11
12
13
14
15
16
17
18
19
20
21
22
23
24
25
26
27
28
|
<lvc:Gauge
Grid.Row="0"
Width="200"
Height="200"
GaugeBackground="#F5F7F9"
HighFontSize="30"
InnerRadius="90"
Uses360Mode="True"
Value="70"
From="0"
To="100">
<lvc:Gauge.GaugeRenderTransform>
<TransformGroup>
<RotateTransform Angle="90" />
<ScaleTransform ScaleX="-1" />
</TransformGroup>
</lvc:Gauge.GaugeRenderTransform>
<lvc:Gauge.GaugeActiveFill>
<LinearGradientBrush>
<GradientStop Offset="0.0" Color="#00eaff" />
<GradientStop Offset="0.5" Color="#2D8CF0" />
<GradientStop Offset="1.0" Color="#2D8CF0" />
</LinearGradientBrush>
</lvc:Gauge.GaugeActiveFill>
</lvc:Gauge>
|
设置单位
1
2
3
4
5
6
7
8
9
10
11
12
13
14
15
16
17
18
19
20
21
22
23
24
25
26
27
28
29
30
31
|
<lvc:Gauge
Grid.Column="0"
Width="220"
Height="220"
GaugeBackground="#F5F7F9"
HighFontSize="30"
InnerRadius="96"
LabelFormatter="{Binding Formatter}"
LabelsVisibility="Visible"
Uses360Mode="True"
Value="{Binding onlineRate}"
From="0"
To="100">
<lvc:Gauge.GaugeRenderTransform>
<TransformGroup>
<RotateTransform Angle="90" />
<ScaleTransform ScaleX="-1" />
</TransformGroup>
</lvc:Gauge.GaugeRenderTransform>
<lvc:Gauge.GaugeActiveFill>
<LinearGradientBrush>
<GradientStop Offset="0.0" Color="#00eaff" />
<GradientStop Offset="0.5" Color="#2D8CF0" />
<GradientStop Offset="1.0" Color="#2D8CF0" />
</LinearGradientBrush>
</lvc:Gauge.GaugeActiveFill>
</lvc:Gauge>
|
类
1
2
3
4
5
6
| public Func<double, string> Formatter { get; set; }
public ChartPageData()
{
Formatter = value => value + "%";
}
|
饼图
xaml
1
2
3
4
| <lvc:PieChart
Name="pieChart1"
Width="300"
Height="300" />
|
代码
1
2
3
4
5
6
7
8
9
10
11
12
13
14
15
16
17
18
19
20
21
| Func<ChartPoint, string> labelPoint = chartPoint => string.Format("{0}人", chartPoint.Y);
SeriesCollection piechartData =
new SeriesCollection{
new PieSeries
{
Title = "未签到",
Values = new ChartValues<double> {numStartClass - numStatisticsOnlineUser},
DataLabels = true,
LabelPoint = labelPoint,
Fill = System.Windows.Media.Brushes.Coral
}, new PieSeries
{
Title = "已签到",
Values = new ChartValues<double> {numStatisticsOnlineUser},
DataLabels = true,
LabelPoint = labelPoint,
Fill = System.Windows.Media.Brushes.DodgerBlue
}
};
pieChart1.Series = piechartData;
|
自定义样式
1
2
3
4
5
6
7
8
9
10
11
12
13
14
15
16
17
18
19
20
21
22
23
24
25
26
27
28
29
30
31
32
33
34
35
36
37
38
39
40
41
42
43
44
45
46
47
48
49
|
<Style x:Key="FontChartAxis" TargetType="{x:Type lvc:Axis}">
<Setter Property="HorizontalAlignment" Value="Center"/>
<Setter Property="VerticalAlignment" Value="Center"/>
<Setter Property="FontFamily" Value="Microsoft Yahei"/>
<Setter Property="FontSize" Value="14"/>
<Setter Property="Foreground" Value="White"/>
</Style>
<Style x:Key="FontStackedColumnSeries" TargetType="{x:Type lvc:StackedColumnSeries}">
<Setter Property="HorizontalAlignment" Value="Center"/>
<Setter Property="VerticalAlignment" Value="Center"/>
<Setter Property="FontFamily" Value="Microsoft Yahei"/>
<Setter Property="FontSize" Value="10"/>
<Setter Property="Foreground" Value="White"/>
</Style>
<Style x:Key="FontColumnSeries" TargetType="{x:Type lvc:ColumnSeries}">
<Setter Property="HorizontalAlignment" Value="Center"/>
<Setter Property="VerticalAlignment" Value="Center"/>
<Setter Property="FontFamily" Value="Microsoft Yahei"/>
<Setter Property="FontSize" Value="10"/>
<Setter Property="Foreground" Value="White"/>
</Style>
<Style x:Key="FontChartLegend" TargetType="{x:Type lvc:DefaultLegend}">
<Setter Property="HorizontalAlignment" Value="Center"/>
<Setter Property="VerticalAlignment" Value="Center"/>
<Setter Property="FontFamily" Value="Microsoft Yahei"/>
<Setter Property="FontSize" Value="12"/>
<Setter Property="Foreground" Value="White"/>
</Style>
<Style x:Key="FontRowSeries" TargetType="{x:Type lvc:RowSeries}">
<Setter Property="HorizontalAlignment" Value="Center"/>
<Setter Property="VerticalAlignment" Value="Center"/>
<Setter Property="FontFamily" Value="Microsoft Yahei"/>
<Setter Property="FontSize" Value="9"/>
<Setter Property="Foreground" Value="White"/>
</Style>
<Style x:Key="FontPieSeries" TargetType="{x:Type lvc:PieSeries}">
<Setter Property="HorizontalAlignment" Value="Center"/>
<Setter Property="VerticalAlignment" Value="Center"/>
<Setter Property="FontFamily" Value="Microsoft Yahei"/>
<Setter Property="FontSize" Value="24"/>
<Setter Property="Foreground" Value="White"/>
</Style>
|